
Read the story of Audrey Banzadio(Talent Acquisition Officer, Loyaltek Group). During our...
Do you need a better understanding of how to improve the profitability of your business?
How useful would it be for you to dive deep down into your performance and see all your transactions conducted over the last years?
And how great would it be to be able to compare your own company to the top 100 businesses in the same sector and the same region as you?
What about facts that teach you more about your customers, their spending habits with you and how often they visit your business?
Such insight into your business would be of immense value right?
This is why we have created a free tool for our merchants designed to make the most of their data. And all available on a monthly transaction report, easily accessible from your MyPaynovate.
Because we don’t believe you have to be a finance expert to succeed in business. What you need is a better understanding of your own business.
This is part of our overall commitment to you, providing valuable add-on services.
What the report shows
The monthly report consists of six charts laid out on two pages that help you read between the lines of your transaction activities. From these you will gain a better understanding of how to improve the profitability of your business.
Page one consists of three graphs:
-
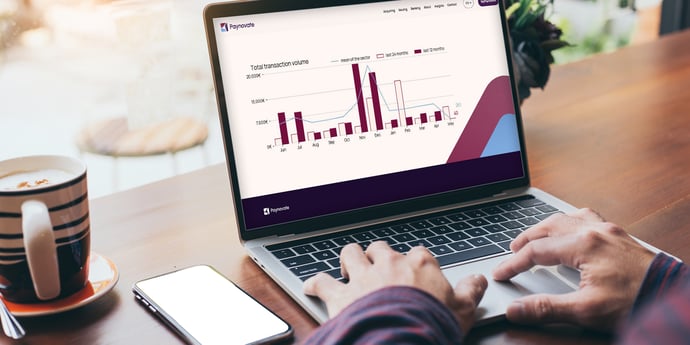
graph one shows your business performance over the past 12 and 24 month periods;
-
graph two indicates how many customers you had and compares that with your competitor’s average. If you lag behind them, it might be time to do some advertising;
-
graph three highlights your regular customers and how often they visit business, and how that compares with the industry average.
On the second page:
- graph one provides an overview of the cards used by your customers;
- graph two shows the proportion of your customers who come from other countries, identifying which nationalities are more inclined to spend their money in your shop;
- graph three enables you to be able to compare your company to the top 100 businesses in the same sector in your region. How many are doing worse than you, but also how many are doing better.
Find this tool full of valuable information in the Reports tab of MyPaynovate. Simply select the month you are interested in and away you go.
We believe this valuable tool represents a major step forward for how you view your business. Now you can better analyse performance, receive insights and identify measures that can be used to improve your competitiveness.
Remember, at Paynovate, success is just a few clicks away!